
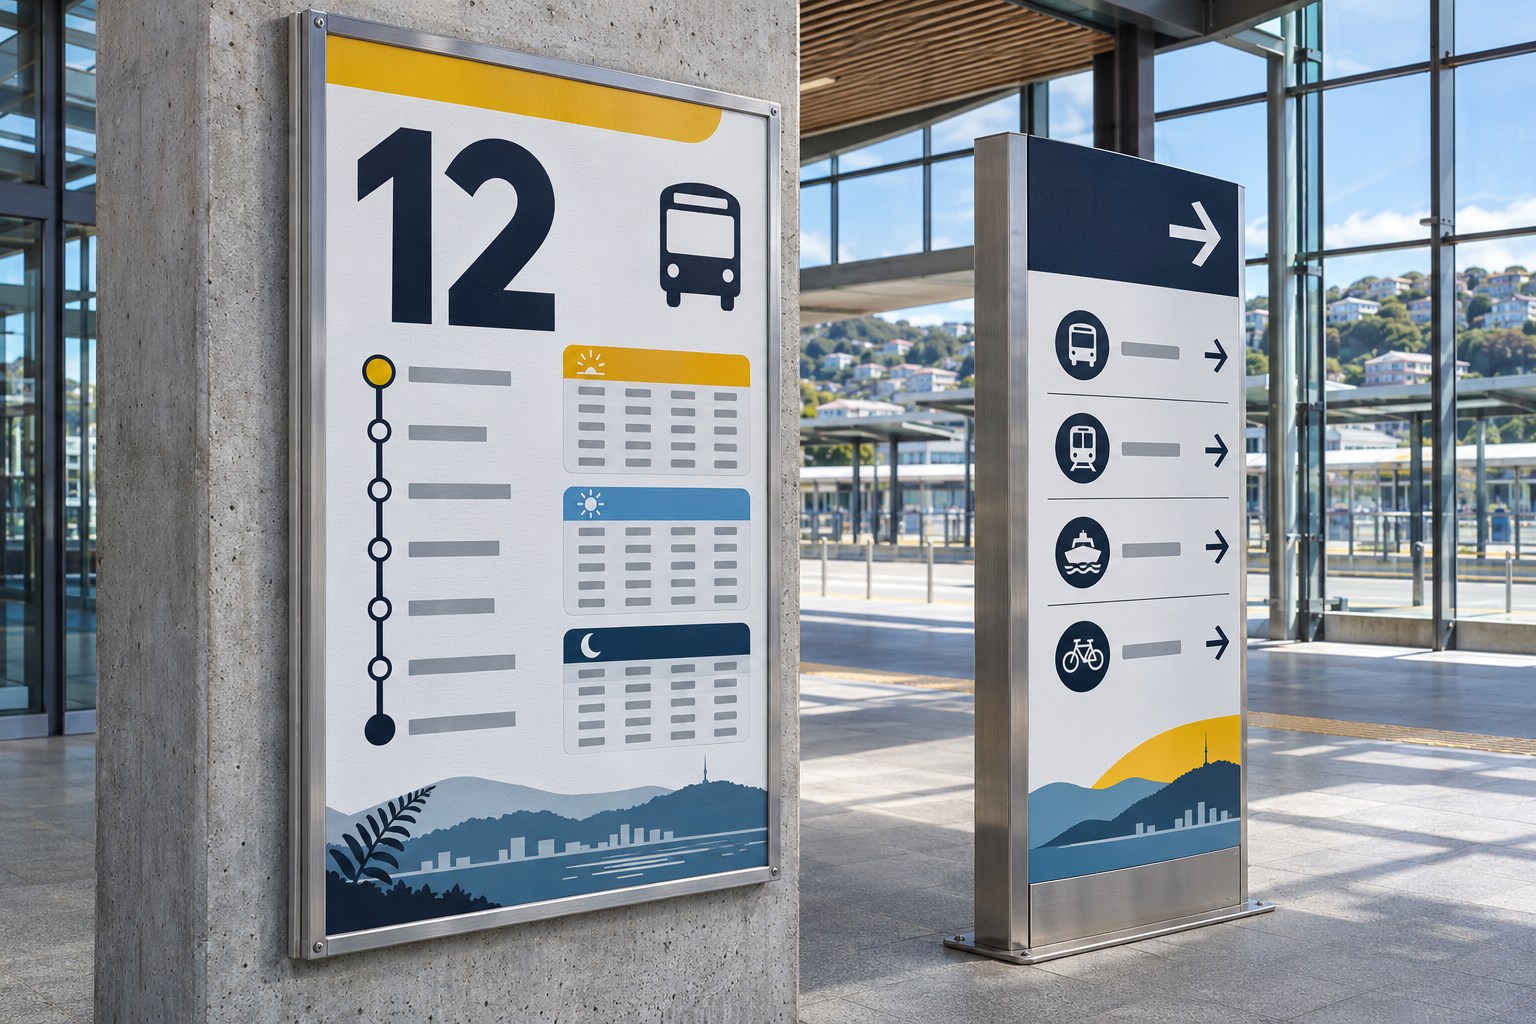
Visual hierarchy gives a graphic design a reading order. It tells someone what to notice first, which details belong together and where their eye should go next. On a poster, the headline might lead; on a price label, the number might. Size, contrast, position and spacing decide which message gets noticed before the viewer reads the smaller print.
Bigger is not always more prominent. A small label against a dark field can beat a large photograph. What matters is whether the audience finds the information it came for.
What visual hierarchy does in graphic design
An information hierarchy ranks the content by purpose: main message, supporting facts and finer detail. Visual hierarchy gives that order a visible form through a focal point and a path through the layout. If the priorities are wrong, more polished styling will only make the wrong information easier to see.
Take a community event poster. The event name explains what is happening; the date and venue tell people whether they can go. Sponsor logos still need a place, but they rarely deserve to be read before the event details. Put those logos at the top and the poster may look official while failing its most basic job.
Emphasis singles out an element; hierarchy ranks several. A headline can be emphatic without making the date or venue easy to find. Balance is different again: it concerns the distribution of visual weight. An asymmetrical design can feel settled even when one part quite deliberately draws the eye first.

The principles that control attention
Size, scale and proportion
Size establishes rank only when the difference is noticeable. A product photograph can lead a packaging design even if the brand sits higher up. A 32-pixel heading barely stands out if every other label is nearly as large. Compare neighbouring elements, not isolated font sizes.
Give the layout three working tiers: primary, secondary and tertiary . Set the dominant headline, image or number first, then scale supporting material around it. Watch decorative illustrations and logos; their proportions can turn them into accidental focal points, regardless of the content brief.
Contrast, colour and visual weight
Contrast comes from difference: dark against light, bold against regular, sharp against soft, or an intensely coloured shape on a quiet background. Luminance (perceived lightness) , hue, saturation, type weight, texture and silhouette all contribute to visual weight. A saturated colour is not automatically legible. A dark heading on a light background can be stronger than a bright heading with little tonal separation.
Use colour to mark a role, not just decorate. An accent can flag prices, dates or navigation states; spread it across every label and it stops signalling anything. Check brand colours over photographs, gradients and patterned backgrounds, where contrast can disappear.
Typography and the reading sequence
Typographic hierarchy separates display headlines, subheadings and body copy, then adds captions, labels or metadata where the task calls for them. Beyond font size and weight, consider typeface, x-height, line length, tracking (letter spacing), kerning (spacing between pairs) and leading (line spacing). These choices affect how easily each level can be read.
In Aotearoa New Zealand , type has another practical test: does it handle te reo Māori correctly- Check the macrons in “ā”, “ē”, “ī”, “ō” and “ū” at every chosen weight, including exported files and fallback fonts. A missing mark changes the appearance of the word and can change its meaning.
Proximity, grouping and Gestalt principles
Gestalt principles explain why we read several objects as a group. Proximity joins nearby items; similarity joins those that share colour or shape; continuity follows an implied line; figure - ground separation lets a subject stand apart from its background. A border or shared region can strengthen the same grouping without adding another heading.
White space, alignment and the grid
White space (negative space) is the area around and within design elements; it need not be white. It can isolate a statement without extra colour or size. The gaps should match the relationships: a heading far from its paragraph looks detached, while unrelated details packed together look connected.
Aligned edges and baselines connect information quietly. A layout grid sets columns, margins and gutters; padding gives cards and labels breathing room inside their boundaries. Symmetry may feel orderly. Asymmetry can create movement and focus. Either fails if the grid makes the main message harder to locate.
Position, direction, imagery and depth
Where an element sits changes its apparent importance. The top, centre and an isolated area of high contrast can all compete for attention. Leading lines , arrows, cropping, perspective and even the direction of a person's gaze can steer a viewer across a photograph or layout.
How to build visual hierarchy from a blank layout
Start with the viewing situation. A poster seen across a room, a menu held at a table and a web form used on a phone demand different information at first glance. The order in the client's content file is not necessarily the order the audience needs.
- Define the job. Who will see it, where, and what must they know first: what is happening, what it costs or where to go?
- Rank the content before styling it. Separate the essential message, supporting details and optional material. The audience's order may differ from the client's.
- Choose one dominant focal point. A headline, image or number can lead. Do not let a logo, badge and photograph all claim equal rank without a reason.
- Establish a type scale and grid. Give headings, body copy and captions consistent roles, then align columns and groups.
- Introduce contrast selectively. Save the strongest size, colour or weight differences for the distinctions that matter. Check the real background.
- Test the sequence in context. View the poster from its intended distance, print at the real size or check the phone layout. Note what appears first, second and third.
Name the first three things a viewer is likely to see. If they are not the content priorities, adjust contrast, placement or grouping before adding decoration.
Visual hierarchy examples for New Zealand design work
An A3 poster for a Wellington community event
Imagine an A3 poster for a weekend arts market in Wellington. The event name leads. Date, opening hours and venue form one group underneath; admission details and participating organisations follow. A vivid photograph can set the mood, provided its crop leaves a legible area for the practical information.
At the expected viewing distance, someone should identify the event and at least one essential detail. On a phone, rearrange the content rather than shrink the A3 poster into a narrow rectangle.
A café menu or retail price label
A café menu is a comparison tool. Group food and drinks, align the prices, and distinguish item names from descriptions. Specials lose their status when each one is shouted in a different colour. Spacing and a consistent type weight often work better than a maze of decorative rules.
A small-business landing page
On a small-business landing page, people need to identify the service and service area quickly. The logo establishes the brand, but the headline must explain the offer without a cryptic slogan. Group service categories, proof and contact details around the questions a potential customer will actually ask.
Mobile layouts change the sequence. Two desktop columns may stack into one; cards move, photographs crop and navigation collapses. Check the responsive reading order as well as visual prominence. A button detached from the explanation it belongs to is a hierarchy problem, even if it remains brightly coloured.
An infographic, map or public information display
For an infographic, make the title say what the chart measures. Keep data marks distinguishable and put labels close to their values. A large statistic needs its unit, time period or comparison base nearby. On maps, thematic data should stand out from the base map; decorative icons must not compete with the evidence.
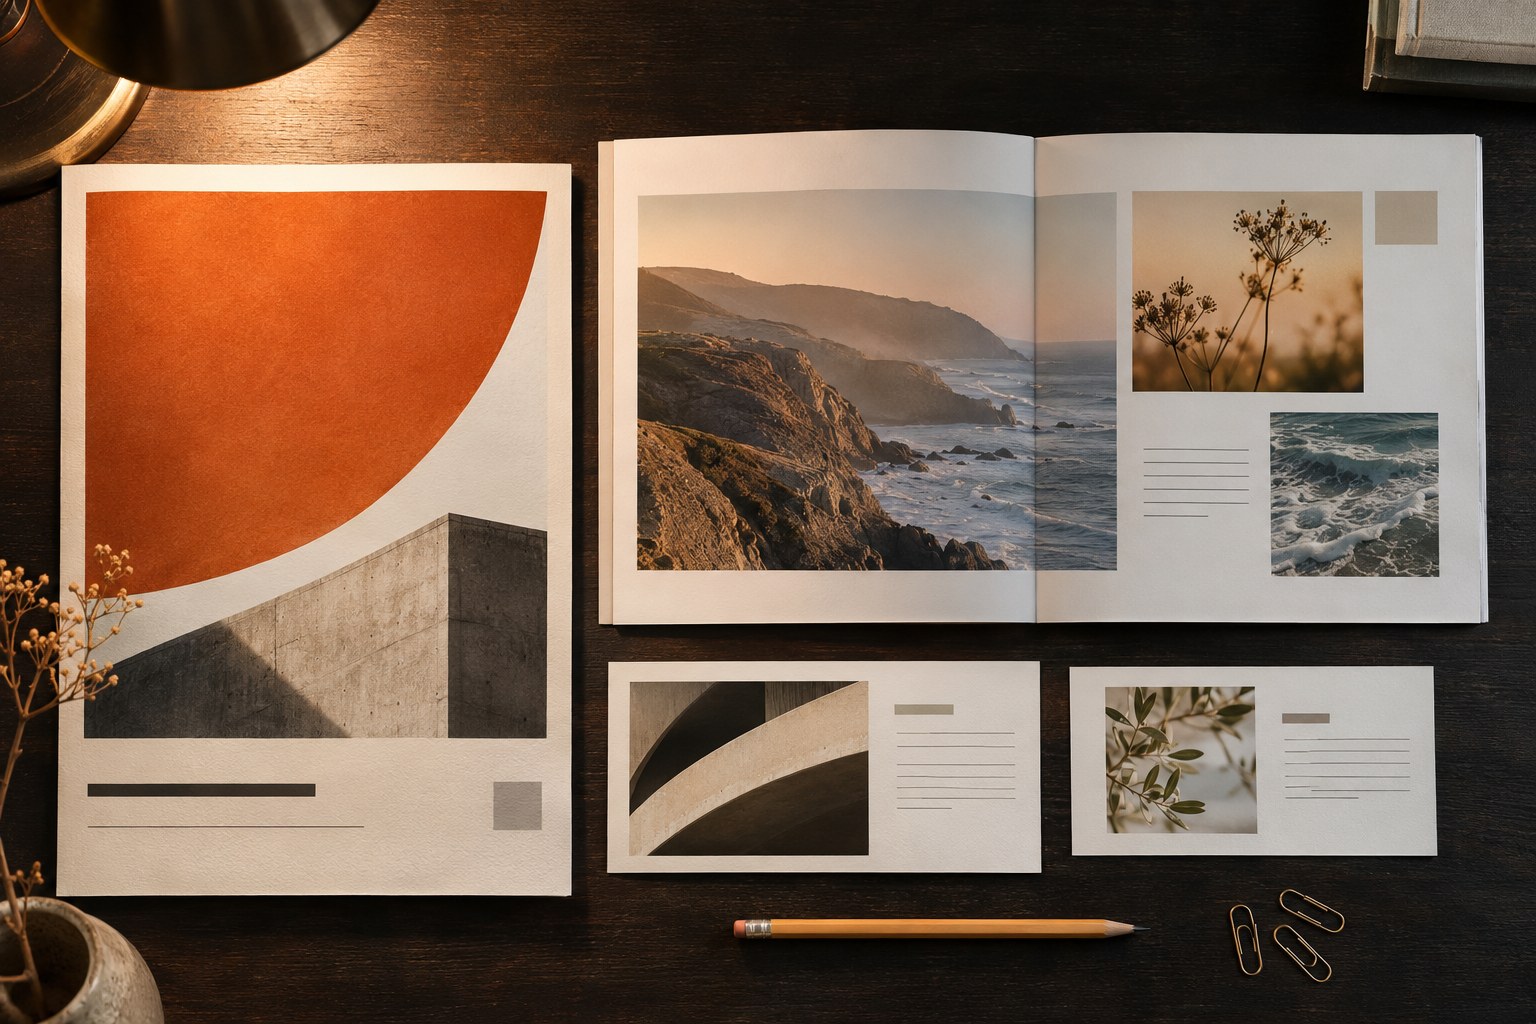
F-pattern and Z-pattern: useful models, not fixed rules
The F-pattern describes a common scan of text-heavy web pages: across the upper lines, then down the left side. The Z-pattern sketches a route across the top, diagonally down and across the bottom, often used to arrange a page with only a few major visual anchors.
Neither pattern guarantees where an individual will look. The task, reading direction, photographs and strong headings can interrupt both. An F-shaped scan can even indicate that readers are skimming a dense page rather than following the intended content. Treat the patterns as layout hypotheses, then check how people locate the information.
Accessible hierarchy is more than an attractive layout
A neat-looking composition can still be difficult to use. Pale grey body text, instructions carried only by colour and headings styled without semantic structure create problems for people using magnification or assistive technology.
For web content, WCAG 2.2 sets a Level AA text-contrast minimum of 4.5:1 for ordinary text and 3:1 for large text . Those ratios do not establish legibility for printed ink. WCAG also covers colour-standalone meaning, resizing and reflow; non-text controls have their own criteria. A page with readable paragraphs is not automatically accessible.
Visual size is not a substitute for heading markup. An
h2
identifies a section under an
h1
, even if the styling says otherwise. Screen readers use this structure in ways they cannot reliably reconstruct from bold text. The
New Zealand Government's guidance on headings
makes the same distinction.
Pair colour-coded states with labels, symbols or underlines. Use real text rather than putting essential wording inside a picture. Test a narrow viewport with enlarged text, especially when English and te reo Māori appear together: line breaks can split the pairings that made sense in the desktop mock-up.
How to tell whether the hierarchy works
A polished mock-up cannot show whether someone finds the right detail. Ask a viewer to locate the venue, final price or next departure and watch where they look. Visual preference is a separate question.
| Check | What to look for | What to change if it fails |
|---|---|---|
| First-glance check | After a brief look, can someone state the main message- | Reduce competing emphasis and strengthen the focal point. |
| Findability task | Can someone locate the date, price, location or next relevant action? | Move associated details together and improve their visual rank. |
| Greyscale check | Does the importance order survive without hue? | Adjust light - dark contrast, type weight and spacing. |
| Distance and scale check | Does the layout hold up at actual poster distance or mobile width? | Rework type sizes, cropping and group placement. |
| Accessibility check | Can people read, enlarge and navigate the content without losing meaning? | Correct contrast, semantic headings, reading order and reflow. |
The squint test shows which shapes and contrasts dominate, not whether the information is accessible. A three-second glance test can expose distractions; the timing is a workshop convention, not a scientifically guaranteed threshold. Give several people the same findability task and note where they hesitate or misread details.
Common visual hierarchy mistakes and how to correct them
- Everything is bold, bright or oversized. Quiet the supporting material; louder headlines will not repair missing contrast.
- The visual centre is not the informational priority. Reposition or crop a dominant image when it hides the date, price or purpose.
- Related details are separated. Put prices near products and headings near their explanations.
- Decorative type compromises readability. Reserve expressive lettering for short displays; give body copy adequate measure and leading.
- Colour alone carries meaning. Add words or symbols; verify the distinction in greyscale and for colour-vision differences.
- A desktop composition is only scaled down. Reorder and stack elements so mobile reading order still works.
- Whitespace is applied uniformly. Keep linked items close and separate unrelated groups.
- Brand expression displaces essential information. Keep restrictions, safety information and other decision-making details visible.
Visual hierarchy questions designers often face
Is visual hierarchy the same as information hierarchy?
No. Information hierarchy decides which content matters and which facts belong together. Visual hierarchy expresses those decisions through contrast, scale and placement. A beautiful layout can faithfully display a poor information order.
Visual Hierarchy vs Visual Flow
Hierarchy ranks elements; visual flow is the route between them. The focal point establishes where to start. Alignment, grouping, repeated components and directional cues influence where the eye travels after that.